Showing posts with label Stocks. Show all posts

Friday, January 27, 2012

Correlation

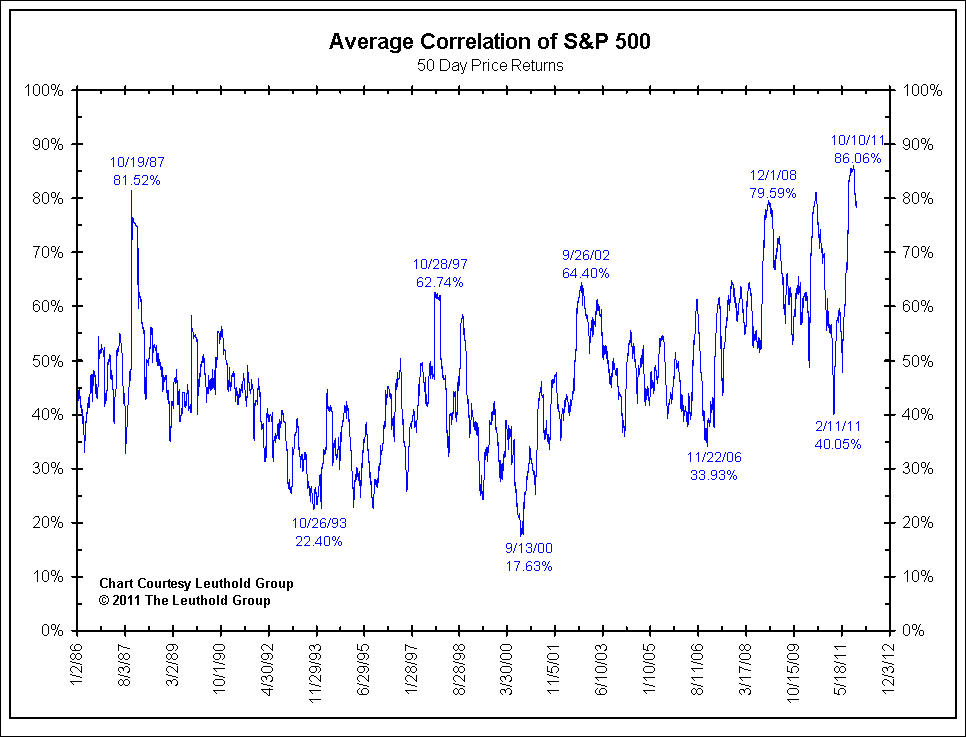
History has shown us that when investors get scared they think in a "risk on" / "risk off" mentality - regardless of the asset class.  These knee-jerk reactions cause an unprecedented amount of correlation in the market.  The following chart does a nice job of showing how fear contributes to the overall correlation of stocks in the S&P 500 dating back to 1986.

More recently, you can see peaks in correlation around the Great Recession, fear of a double dip recession, uncertainty surrounding the Eurozone's debt calamity, and the possibility of global contagion.


Source:
www.ritholtz.com

Friday, January 13, 2012

Gigantic Facebook IPO

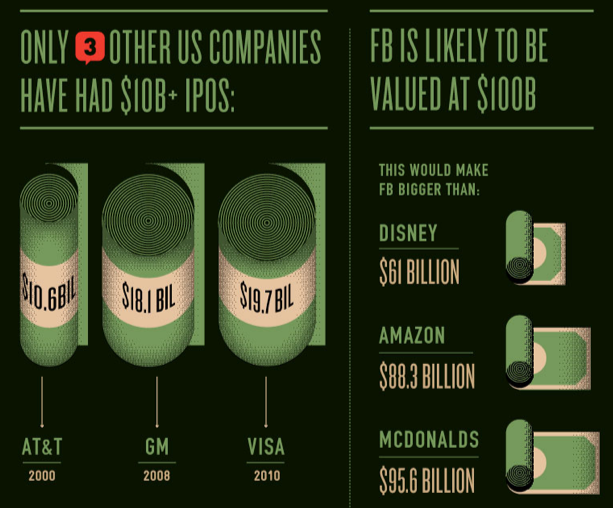
The picture says it all - these other behemoth companies sit in the shadows of Facebook's impending IPO. Let's be serious though, you shouldn't be surprised based on the amount of time you spend checking your news feed and stalking your "friends".


Source:
www.ritholtz.com

Wednesday, January 11, 2012

Mo' Money Mo' ... Dividends?

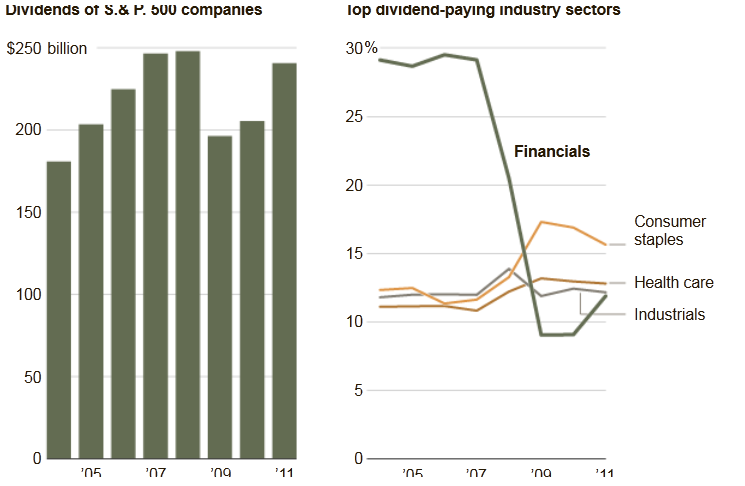
According to data recently released by S&P, companies are on track to pay a record $252 billion in dividends in 2012 based on tracking dividend rates of 394 companies. Stocks of companies that paid dividends did very well in 2011 and the theme should continue into 2012. Below is a dividend trend chart and a breakdown of the top dividend payers by sector...


Source:
NYT

Friday, January 6, 2012

Real return vs. Nominal return


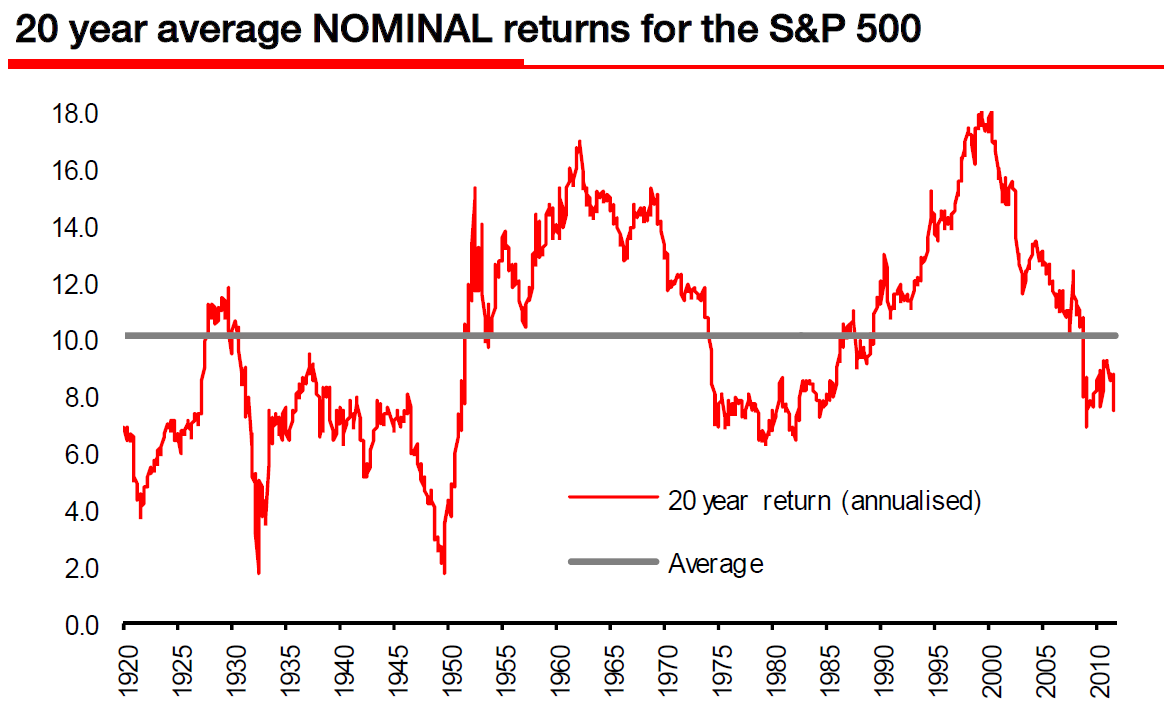
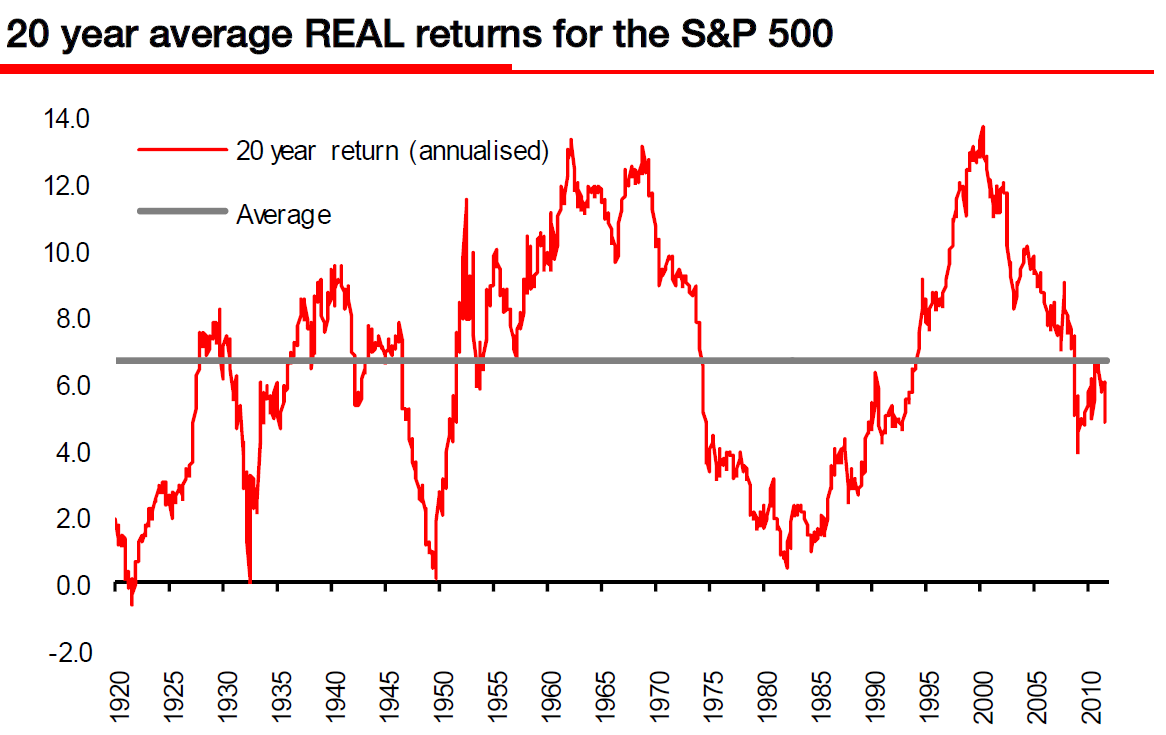
Referring to the graphs below, you can see that over the long term, the S&P 500 has returned an average NOMINAL return of about 10%. Adjusting for inflation, the bottom chart shows the average REAL return for the S&P 500 at about 7%. After ending the year precisely where it started in 2011, perhaps the S&P can revert to the mean in 2012.

Real return = Nominal return - Inflation


Source:
www.ritholtz.com

Wednesday, January 4, 2012

2011 Forecast Report Card


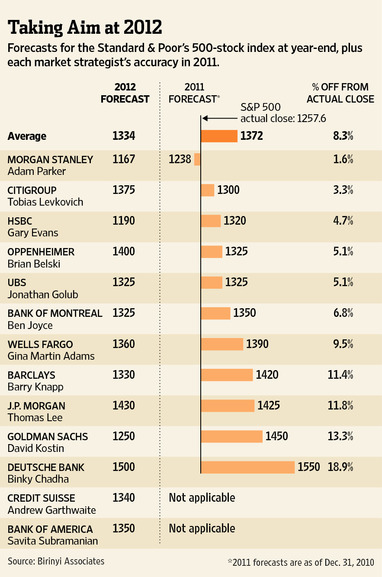
2011 was a wild ride for stocks, but in the end we closed not far from where we began the year. As the chart below illustrates, many market strategists were too optimistic. This just goes to show that even the wizards of Wall Street don't have a crystal ball.

Source: 
Birinyi Associates
www.ritholtz.com


Friday, December 23, 2011

Dividend Paying Stocks

Lately, you can't browse investment news without hearing about dividend paying stocks. What is behind this feverish sentiment and why is it important now?

To begin, a dividend is a sum of money paid by a company on regular intervals to its shareholders. A stock's dividend is calculated by totaling the annual sum of payouts made by the company and dividing that by the current stock price. This ratio is your dividend yield. 

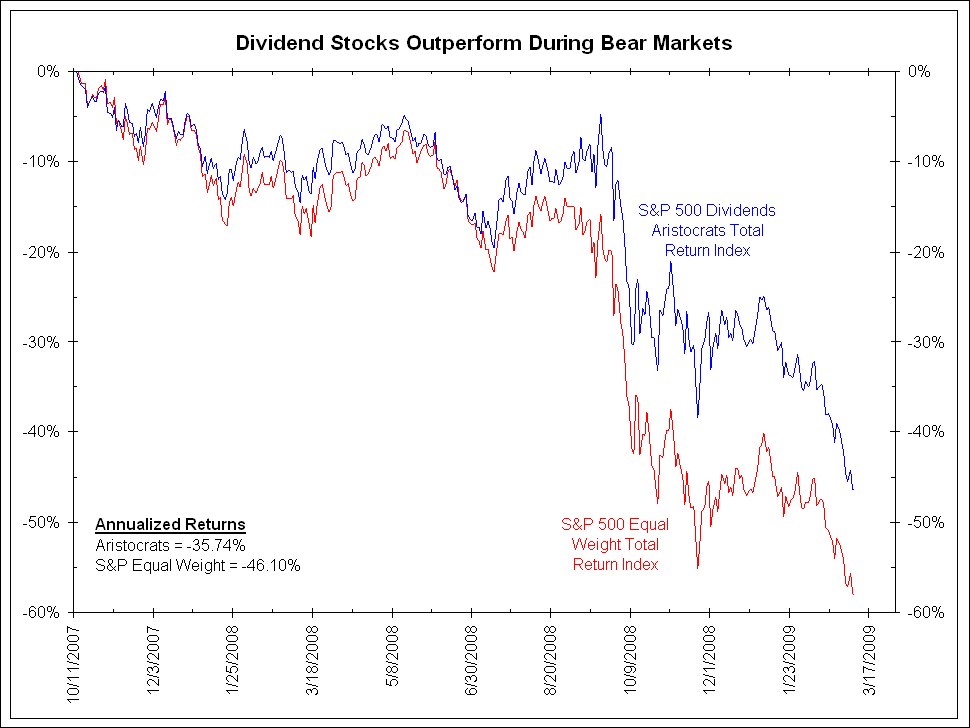
Companies that pay consistent dividends are usually less volatile than their cash-hoarding contemporaries. Throughout the course of the year, these value oriented businesses are run in such a way that they plan to return portions of their profits back to shareholders. Conversely, growth oriented companies take all of their profits and reinvest them directly back into the business for future expansion. Cases can be made for each side in deciding the winner of the value vs. growth stock preference, but the truth is that dividend payers typically outperform during bear markets and growth stocks typically outperform during bull markets (as seen in the graphs below). 

Why now? Investors who still want to own stocks for the growth, but don't want as much volatility should be comfortable with dividend payers. However, this begs the question: are we still in a bear market, or are we entering a new bull market? The answer to that question should play a role in your current allocation.


Sources:
www.ritholtz.com

Wednesday, December 21, 2011

The Emotional Investor


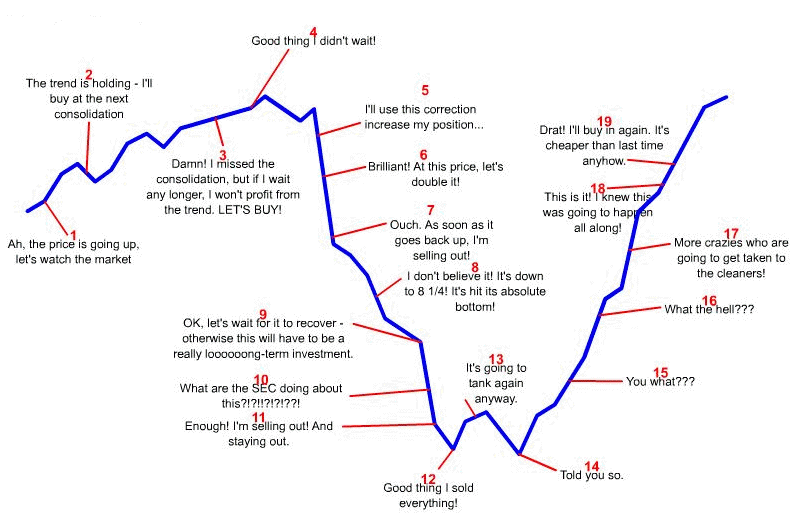
With volatility through the roof recently, emotions have been running high in the investment community. This sentiment can be dangerous for returns! Remember this: emotions have no place in investing or speculating. Only research and facts should drive our decisions. The following charts from do a great job of showing what the emotional speculator goes through as he loses money.


Source:
www.ritholtz.com

Thursday, December 1, 2011

The January Effect

The January Effect is a phenomenon in the stock market driven by year-end tax harvesting. Investors frequently sell their current losers before December 31st in order to claim a capital loss for tax purposes. In turn, this money is reinvested in the market during the first week of January, causing stock prices to rise. Even if a stock has great growth prospects, price momentum matters. After all, it is what drives our profitability, or lack thereof.


Wednesday, November 30, 2011

Goldman Sachs Top Trades for 2012

Goldman Sachs released their top picks recently. While they didn't do so hot in 2011, their 2010 trades were more fruitful. Here is what they think for 2012:


1. Short European High Yield credit (Buying protection on the iTraxx Crossover index), for a target of 950bp (opened at 770bp) and a potential return of 4.5%, stop at 680bp

2. Short 10-yr German Bunds for a target of 2.8% (open at 2.3%) and a potential return of +4.5%, stop 2.0%

3. Go long EUR/CHF for a target of 1.35 (opened at roughly 1.2260) and a potential return of 11% including carry, stop at 1.20

4. Long Canadian equities (S&P TSX) vs Japanese equities (Nikkei), FX unhedged for a target of 120 (opened at 100) and a potential return of 20%, stop at 90

5. Long a Global Rebalancing Basket (CNY, MYR versus GBP, USD) for a target of 107 (opened at 100) and a potential return of 7%, stop at 98

6. Long July 2012 ICE Brent Crude Oil futures for a target of $120/bbl (opened at $107/bbl) and a potential return of 12%, stop at $100/bbl

Source: Zero Hedge