Showing posts with label Economy. Show all posts

Friday, January 27, 2012

Correlation

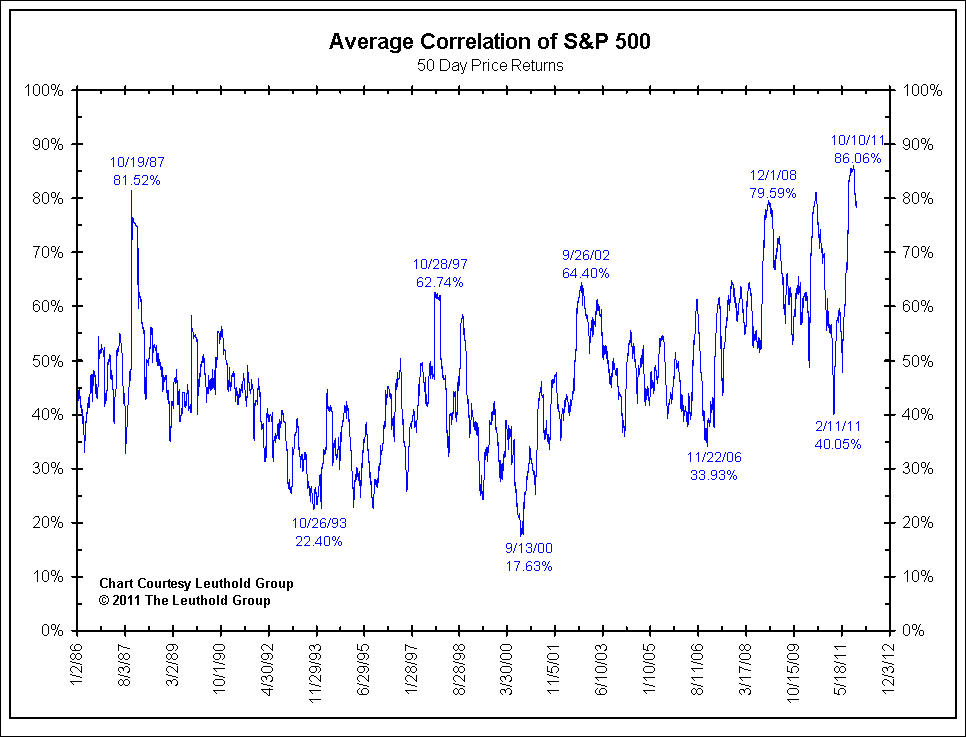
History has shown us that when investors get scared they think in a "risk on" / "risk off" mentality - regardless of the asset class.  These knee-jerk reactions cause an unprecedented amount of correlation in the market.  The following chart does a nice job of showing how fear contributes to the overall correlation of stocks in the S&P 500 dating back to 1986.

More recently, you can see peaks in correlation around the Great Recession, fear of a double dip recession, uncertainty surrounding the Eurozone's debt calamity, and the possibility of global contagion.


Source:
www.ritholtz.com

Friday, December 23, 2011

Dividend Paying Stocks

Lately, you can't browse investment news without hearing about dividend paying stocks. What is behind this feverish sentiment and why is it important now?

To begin, a dividend is a sum of money paid by a company on regular intervals to its shareholders. A stock's dividend is calculated by totaling the annual sum of payouts made by the company and dividing that by the current stock price. This ratio is your dividend yield. 

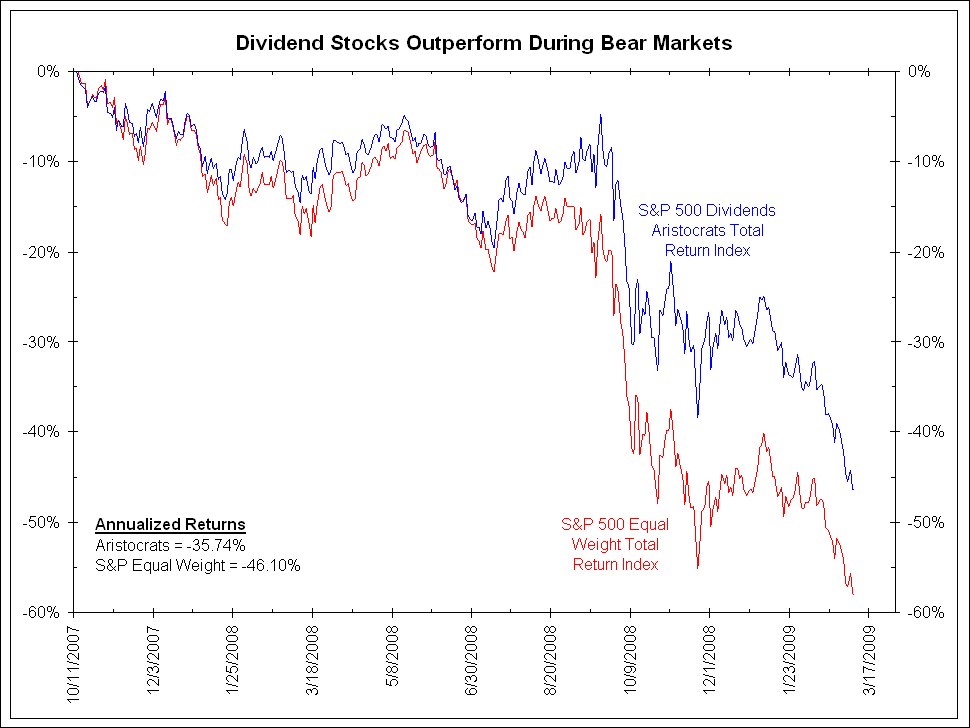
Companies that pay consistent dividends are usually less volatile than their cash-hoarding contemporaries. Throughout the course of the year, these value oriented businesses are run in such a way that they plan to return portions of their profits back to shareholders. Conversely, growth oriented companies take all of their profits and reinvest them directly back into the business for future expansion. Cases can be made for each side in deciding the winner of the value vs. growth stock preference, but the truth is that dividend payers typically outperform during bear markets and growth stocks typically outperform during bull markets (as seen in the graphs below). 

Why now? Investors who still want to own stocks for the growth, but don't want as much volatility should be comfortable with dividend payers. However, this begs the question: are we still in a bear market, or are we entering a new bull market? The answer to that question should play a role in your current allocation.


Sources:
www.ritholtz.com

Thursday, December 22, 2011

Signs of Life

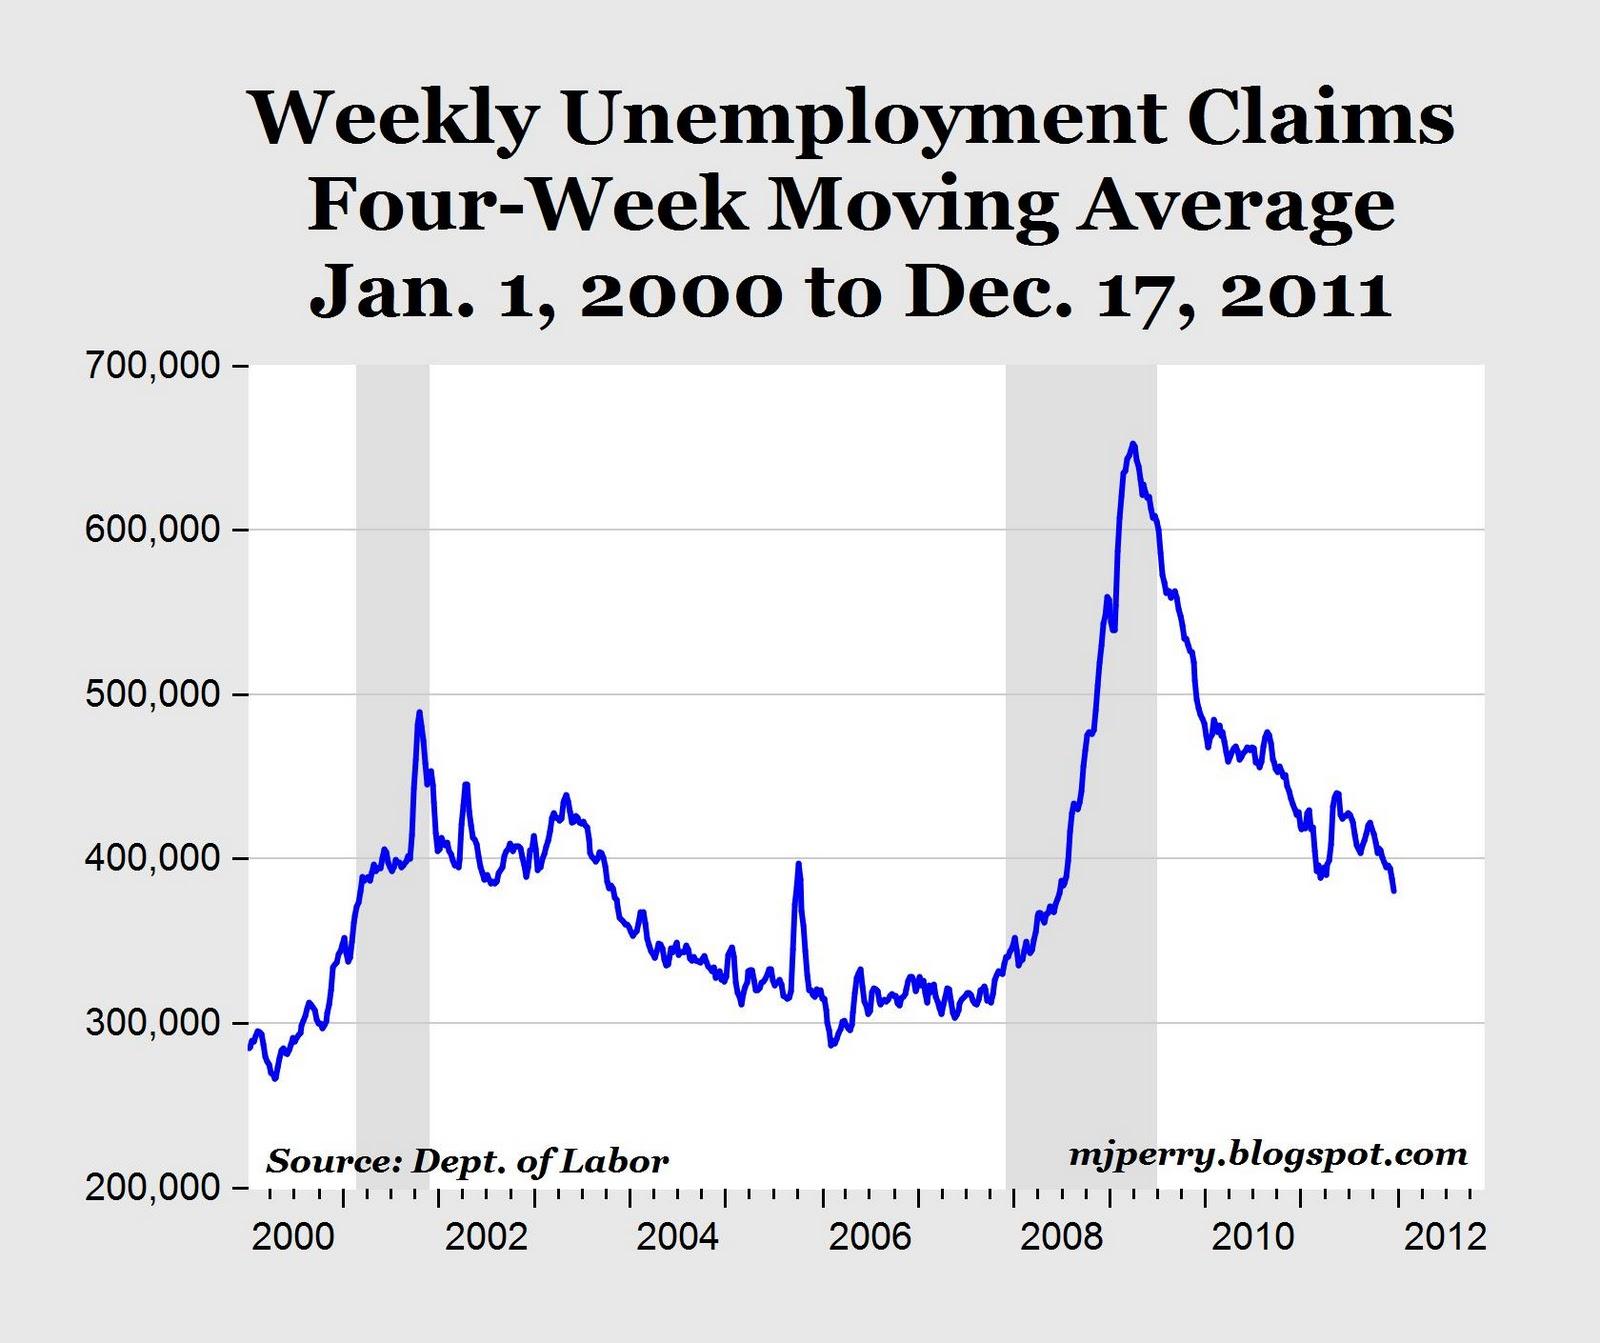
Even though it may not feel like we are making any economic progress, we are slowly clawing our way back to normal. Weekly jobless claims beat analyst estimates yet again dropping to 364,000 - the lowest reading since April 2008. Moreover, the four-week moving average is now at 380,250 claims per week. The last time we had jobless claims numbers like this was June 2008. While the overall unemployment picture still remains stubbornly high at 8.6%, we have continued to improve, slowly but surely.


Sources:
SeekingAlpha.com
Federal Reserve Bank of St. Louis

Thursday, December 15, 2011

TED Spread

The TED Spread is a common reference for determining the amount of stress banks are having raising short-term cash. Specifically, it is the difference between three-month Eurodollar contracts (represented by LIBOR) and three-month Treasury Bill yields.

Historically, it has been a good indicator of perceived credit risk in the overall economy because T-Bills are generally thought to be risk-free offerings and LIBOR measures the credit risk of lending to commercial banks. The difference is a premium for taking on additional risk.

Currently, the TED Spread sits at a new 52 week high of 56.82. Banks aren't lending to each other for a reason: they don't like the odds of repayment.

This can have serious consequences for a global economy trying to emerge from stagnation, and an even bigger impact for those countries trying to avoid a recession.


TED Spread Chart via Bloomberg:
Dec. 14, 2011
%20%28Bloomberg%29

Sources:
Bloomberg.com
Bankrate.com

Wednesday, December 14, 2011

US Housing Prices: A Reflection of Japan?

This chart is an unsettling illustration of the similarities between the home pricing in the USA and that of Japan shifted by 15  years. Japan's real estate peaked in 1992 and was hurting for decades after. Hopefully, similar economic stagnation is not the case for the US in years to come...


Sources:
http://www.ritholtz.com
Richard C. Koo
Nomura Research Institute, Tokyo
Real-World Economics Review, Issue # 58

Thursday, December 8, 2011

Weekly Jobless Claims

This morning brought in good employment information: the number of people who filed for initial jobless benefits came in lower than expected at 381,000, compared to the consensus estimate of 395,000. This number is down 23,000 from last week's measurement of 404,000.

As a result, the four-week moving average was reduced to 393,250. This is the lowest measurement since April.

Source:
Department of Labor

Monday, December 5, 2011

Weak Dollar Weakness?

The US Dollar has recently been hovering at historically low levels compared to the last several decades. Don't let that dent your pride in the stars and stripes though. Dollar devaluation entices other countries to buy American goods, driving up our exports (as an important component of our GDP) and ultimately boosting growth in our economy. Higher growth should eventually lead to corporate hiring and hopefully a sustainable recovery. While a weak US dollar isn't a panacea, adding a little water and sunlight to our economy can only help.


Thursday, December 1, 2011

Rail Traffic Shows That Economy Is Growing

The Association of American Railroads released their weekly data today. While their comments weren't indicative of flourishing growth, investors can still take this as evidence of economic expansion.
"AAR today reported gains in weekly rail traffic, with U.S. railroads originating 265,304 carloads for the week ending Nov. 26, 2011, up 4 percent compared with the same week last year. Intermodal volume for the week totaled 190,866 trailers and containers, up 3.7 percent compared with the same week last year.
Ten of the 20 carload commodity groups posted increases compared with the same week in 2010, including: motor vehicles and equipment, up 42 percent; crushed stone, sand and gravel, up 30.3 percent, and petroleum products, up 28.4 percent. The groups showing a significant decrease in weekly traffic included: farm products excluding grain, down 18.1 percent, and waste and nonferrous scrap, down 10.8 percent.
Weekly carload volume on Eastern railroads was up 1.8 percent compared with the same week last year. In the West, weekly carload volume was up 5.3 percent compared with the same week in 2010. 
For the first 47 weeks of 2011, U.S. railroads reported cumulative volume of 13,710,056 carloads, up 1.8 percent from the same point last year, and 10,775,044 trailers and containers, up 5.1 percent from last year."

Sources: 
Pragmatic Capitalism
AAR

Tuesday, November 29, 2011

Structural Unemployment

14 million Americans are unemployed and yet one sector can't hire new employees fast enough. Looking at the charts below, it is plain to see that manufacturing job vacancies in the United States aren't being filled to meet demand. In fact, the October 2011 unemployment rate for manufacturing was 7.7% compared to the overall unemployment rate of 9.0% (per the Department of Labor).

Consider this, on average it takes companies about 7 weeks to fill a vacant job. Recently, hiring a new manufacturing employee has taken approximately 12 - 15 weeks.

This data supports the notion that there is structural unemployment in our economy, where American skills and American jobs are mismatched. High unemployment rates aside, think of the lost production / GDP / consumption our economy is missing out on.

Fixing structural unemployment will take time. Troops returning home will have solid military training, which may translate well into the manufacturing workplace, but that alone is not the solution. Americans will either have to outsource a segment of this supply chain or place a larger emphasis on trade skills in our educational system.

One thing is certain: manufacturing is fueling much of our economy's current growth. We need to support the strength of this sector.


This graph illustrates how job openings in the manufacturing sector have outpaced total nonfarm job openings from the depths of the recession.


Sources:
stlouisfed.org
cleveland.com
Wednesday, November 23, 2011

October Industrial Production Beats Estimates

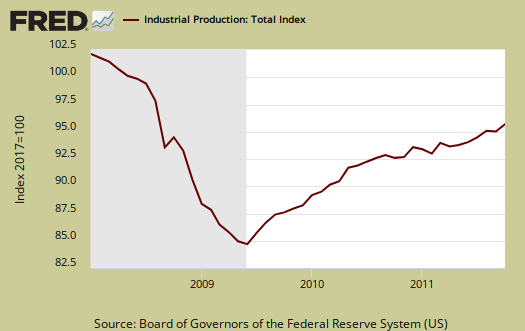
Industrial production expanded by 0.7% in October, beating analyst estimates of 0.4%. However, the reading for September, initially reported at .2%, was revised down to -.1%. That being said, actual two month industrial production is right in line with analyst estimates. The graph below demonstrates how this sector continues to be a source of support for our recuperating economy.


 Specifically, this production data measures the total output of manufacturing, mining, electric and gas industries in the United States. At current levels, industrial production is still 5.3% below pre-recession levels.

The Federal Reserve published a nice breakdown of the industry groups that contribute to industrial production:
"Manufacturing output increased 0.5 percent in October and was 4.1 percent above its year-earlier level. In October, the factory operating rate moved up to 75.4 percent, a rate 11.0 percentage points above its trough in June 2009 but still 3.6 percentage points below its long-run average.
The output of durable goods increased 0.8 percent in October and has gained 7.8 percent in the past 12 months. Advances of at least 2 percent were reported in October for electrical equipment, appliances, and components; motor vehicles and parts; and aerospace and miscellaneous transportation equipment. In contrast, losses of 2 percent or more occurred for wood products and nonmetallic mineral products.


The index for nondurable manufacturing rose 0.2 percent in October. Among the major components of nondurables, the output of apparel and leather jumped 2.8 percent, and gains were also registered for food, beverage, and tobacco products; chemicals; and plastics and rubber products. Decreases were recorded for textile and product mills, paper, printing, and petroleum and coal products. The index for other manufacturing (non-NAICS), which consists of publishing and logging, declined 0.2 percent.


The output of mines climbed 2.3 percent in October, with gains in each of its major components, after having dipped 0.5 percent in September. Capacity utilization in mining moved up to 92.7 percent in October, a rate 5.3 percentage points above its long-run average. The output of utilities edged down 0.1 percent, and its operating rate declined to 77.5 percent, a rate 9.1 percentage points below its long-run average.


Capacity utilization rates in October at industries by stage of process were as follows: At the crude stage, utilization increased 1.5 percentage points to 89.9 percent, a rate 3.5 percentage points above its long-run average; at the primary and semifinished stages, utilization edged down 0.1 percentage point to 74.0 percent, a rate 7.3 percentage points below its long-run average; and at the finished stage, utilization rose 0.7 percentage point to 77.2 percent, a rate 0.1 percentage point below its long-run average."

Source: Federalreserve.gov

Tuesday, November 22, 2011

Q3 GDP Revision

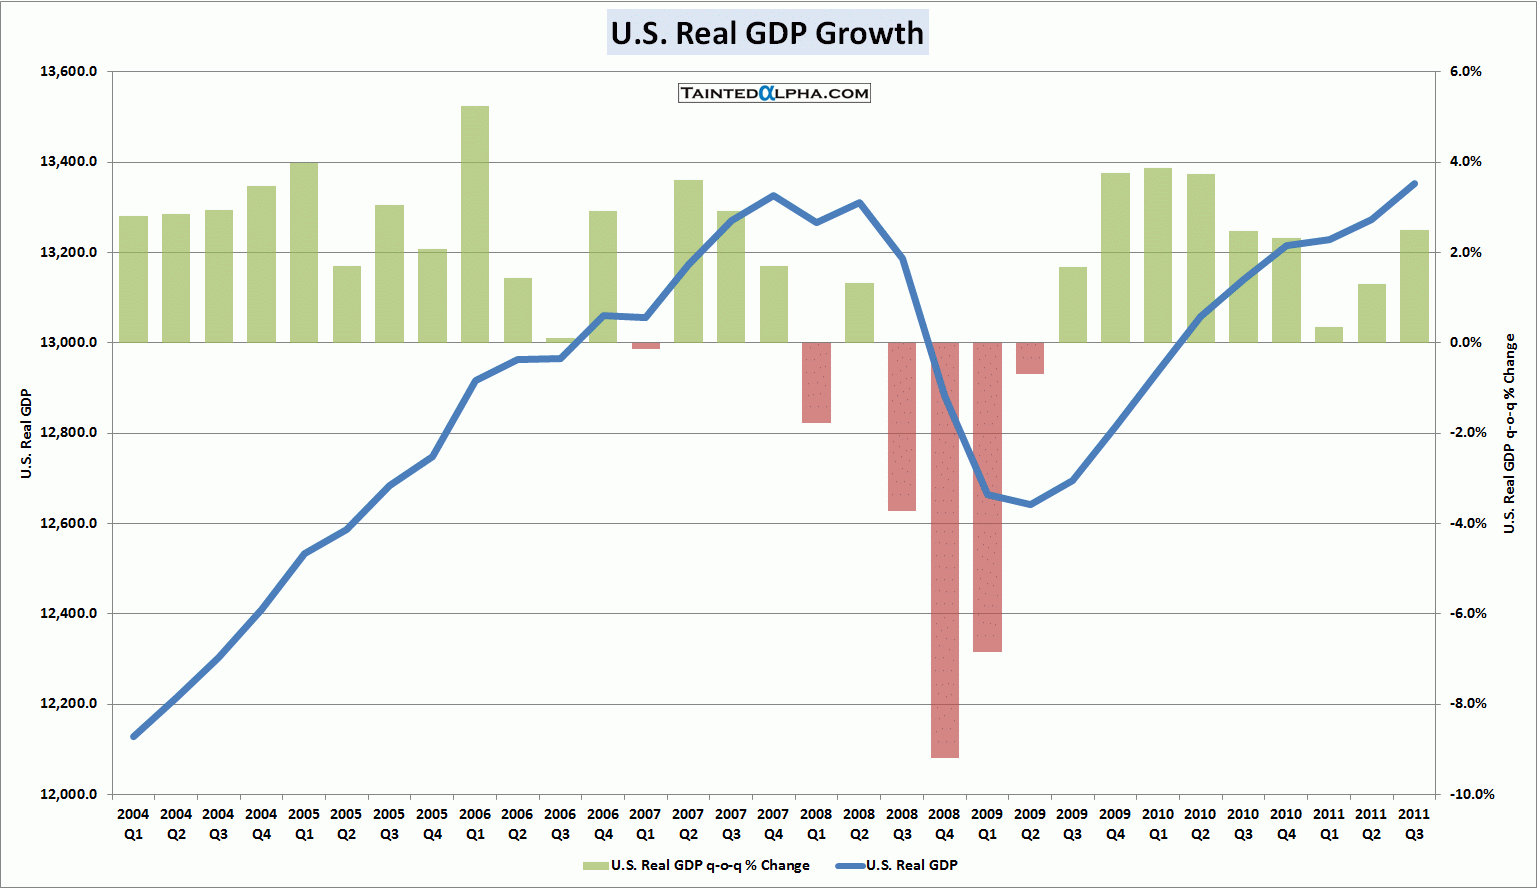
This morning, the revised Q3 GDP (Gross Domestic Product) data was released. After revisiting the numbers, the Commerce Department lowered their initial growth estimate of 2.5 % down to an even 2%.

In economic theory, Okun's law describes the relationship between quarterly changes in GDP growth and quarterly changes in the unemployment rate. Generally speaking, reduction in the unemployment rate trails GDP growth by about 2%. Therefore, with the current economy displaying anemic growth of 2%, the unemployment rate will remain at 9% for the near term.

After digesting this information, the stock markets opened modestly lower.


Source: TaintedAlpha.com


Following a GDP growth reading of 1.3% for the second quarter, growth of 2.5% would have been a large jump.